Customer Purchasing Loyalty
- Julio Antinozzi
- Oct 25, 2024
- 4 min read

Updated: Oct 29, 2024

The Problem and the Dataset
These days, many people tend to shop at one or two grocery stores. I aim to predict the loyalty points of specific customers and identify what influences their loyalty patterns. The dataset I am using is focused on Customer Purchasing Behaviors, which includes information such as purchase frequency, purchase amount, and annual income. I plan to use regression analysis to predict customer loyalty scores. If you're not familiar with regression, that's not an issue!
Regression
Regression is a technique for predicting a continuous outcome by identifying the relationship between a dependent variable and one or more independent variables. This method helps understand how changes in the independent variables influence the dependent variable.
Linear Regression
One of the most widely used types of regression is linear regression. It can be categorized into two forms:
Simple Linear Regression: Involves just one independent variable influencing the dependent variable. Formula: y = k + Bx
Multiple Linear Regression: Involves more than one independent variable affecting the dependent variable. Formula: y= k +B1x1+B2x2...+Bnxn
Variables:
y: dependent variable
k: constant
B: slope
x: independent variable
n: number of linear components
Both forms aim to model the relationship between the variables by fitting a straight line through the data.
Initial Pre-Processing
I started by deleting all unnecessary data, including the purchaser's ID, region, and age. Next, I created a correlation heatmap of the remaining features to ensure they were well-aligned. Fortunately, all the correlations were above 90%, indicating that most features correlated well with one another. This made the linear regression process much smoother.

With this correlation map, I thought it was extremely simple therefore I wanted to make a more intricate heatmap to see the correlation way better.
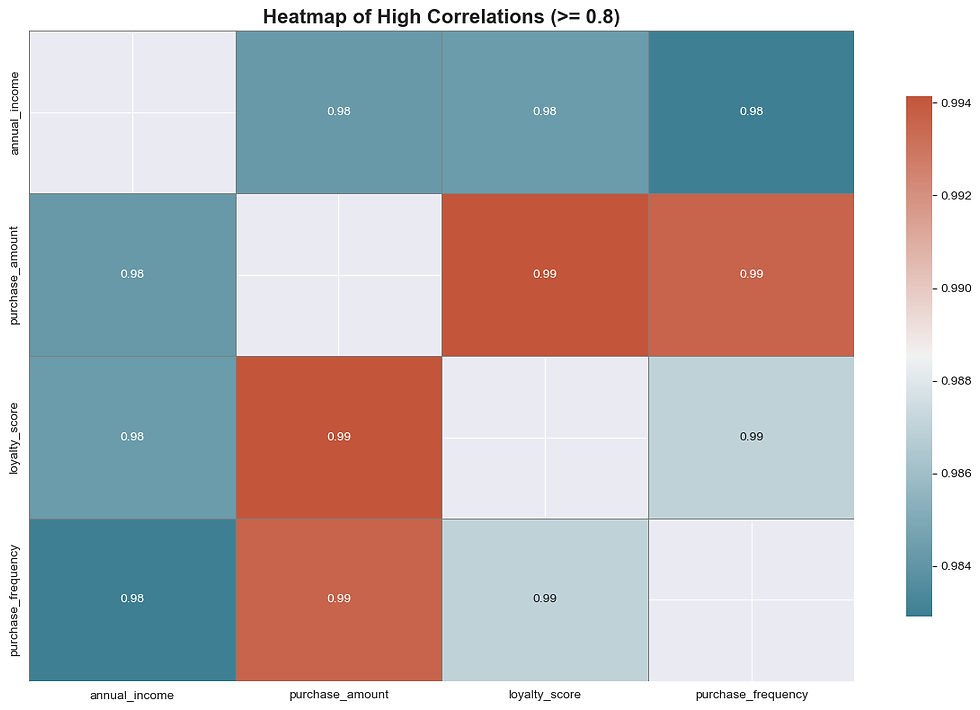
This heatmap is much improved and demonstrates how close we are to reaching 100%, based on the information I preprocessed in the data frame. Additionally, I removed any null values that could potentially disrupt the accuracy of the data.
Experiment 1

I initiated the linear regression training process by dividing the dataset into training and testing sets, a commonly accepted practice. In this context, X represents all the independent variables, while Y signifies the loyalty score I aim to predict. Thanks to thorough preprocessing—where I eliminated irrelevant data and cleaned the data frame—I achieved an impressive training accuracy of 99%. This is quite a noteworthy accomplishment! To enhance the clarity of my findings, I decided to create visualizations that simplify the data for those who might find numerical information overwhelming. These graphical representations effectively highlight the relationships and trends within the dataset, making it more accessible to understand the underlying concepts. Fortunately, all null values were successfully removed, ensuring the dataset remained clean and precise. Based on my analysis, I hypothesize that yearly income significantly influences customer loyalty. The idea is straightforward: higher-income individuals tend to spend more at a particular store, which likely fosters greater loyalty.

Experiment 2
In my second experiment, I aimed to challenge my dataset by including information that was irrelevant to actual customer purchasing loyalty. Despite my attempts to complicate the test, it still performed remarkably well. Although the accuracy percentage decreased, the results were impressive given the obstacles I introduced.
I included factors like customer region and customer ID, which are fundamentally irrelevant to my research. I was surprised that the test still yielded positive outcomes. I believe this was due to my thorough preprocessing; I cleaned all the data, even the parts I planned to disregard in the first experiment. I knew I would eventually use all the data I received from the dataset to complicate the test.


Experiment 3
In this code, a regression analysis was conducted to predict purchase_frequency using other features from a dataset. First, the data was prepared by separating the target variable (purchase_frequency) from the feature set. Then, the data was split into training and test sets, reserving 20% of the data for testing and setting a random state for reproducibility. Afterward, a linear regression model was created and trained on the training data, and predictions were made on the test set. To evaluate the model, the Mean Squared Error (MSE), measuring the average squared difference between predicted and actual values, and the R-squared (R²) score, which indicates how well the model explains the variance in purchase_frequency, were calculated. Additionally, three plots were created to visualize the model’s performance: (1) an Actual vs. Predicted plot to compare predicted values against actual values, with a red line representing ideal predictions, (2) a Residual Plot to show the difference between predicted and actual values, and (3) a density plot using kernel density estimates to display the distribution of actual vs. predicted values. These visualizations provide insights into the model's prediction accuracy and error patterns.


Impact Section
The impact section of this project focuses on customer loyalty, aiming to understand what drives this loyalty at a fundamental level. The insights gained from this study can help grocery stores identify strategies to retain their customers, irrespective of distance.
From my analysis, it appears that purchase frequency and yearly income are two key factors influencing whether customers continue to shop at a store. The observation is straightforward: when customers have disposable income, they are more likely to frequent grocery stores. This raises ethical considerations, as it suggests that financial means play a significant role in consumer behavior and loyalty.
While it's practical for businesses to leverage these insights to enhance customer retention, it's also essential to acknowledge that such a reliance on income might not be a healthy foundation for loyalty. This reliance could limit access for lower-income customers, leading to inequities in shopping experiences and loyalty outcomes. Understanding these dynamics is crucial for fostering a more equitable retail environment.
Conclusion
This project taught me a lot about customer behavior and what truly drives people to become "loyal." While the results weren't surprising, it was still valuable to see how statistical data influences loyalty. In the real world, grocery stores can cultivate customer loyalty through a monetary hierarchy; the more money a person has, the more loyal they tend to be to a particular store. In conclusion, the project visualizes the statistical data showing the relationship between customer loyalty levels and their preferred grocery store, as well as the factors that encourage these customers to return.


Comments